
Market Report
Worland, Wyoming.
Track Worland's residential real estate market through monthly reports built from verified NWBOR MLS data. Review the latest market snapshot, explore 12-month trends, and compare historical market conditions through inventory levels, sales activity, days on market, median pricing, and months of supply to see where the market is headed.
As of June 2026
Seller-favored market · 3.8 months of supply
- Strong seller's
- Seller-favored
- Balanced
- Buyer-favored
- Strong buyer's
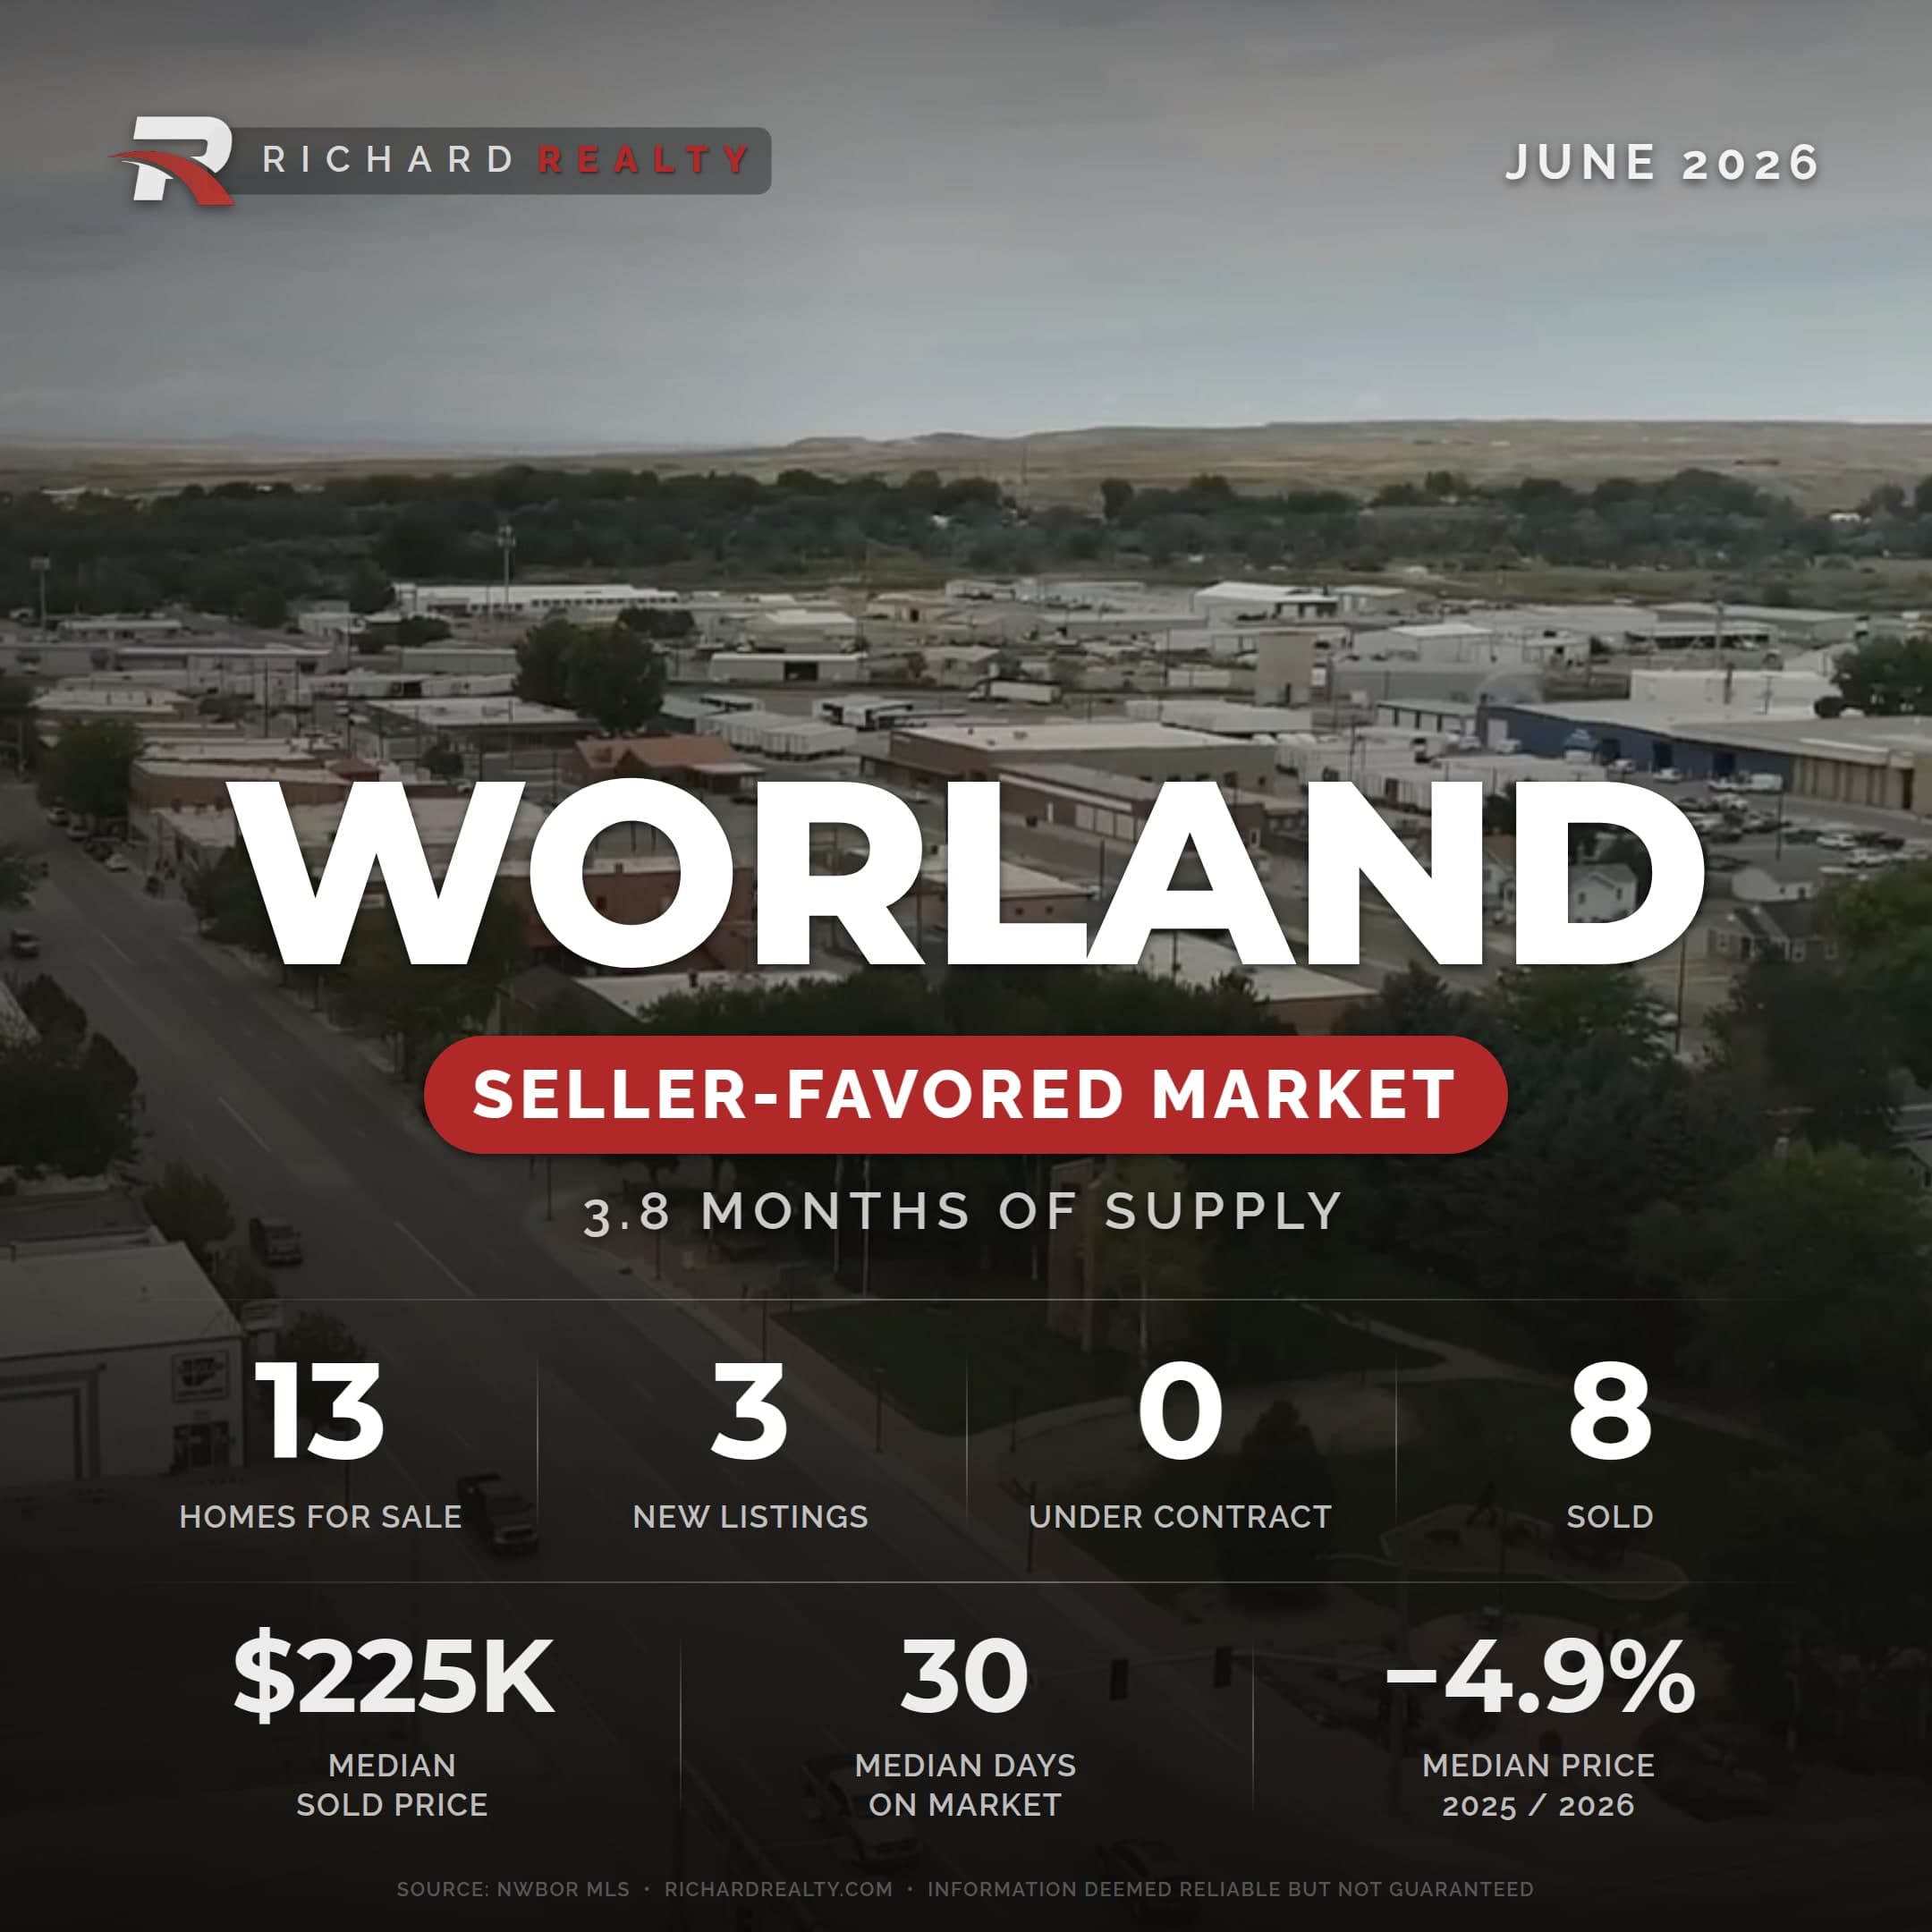
As of June 2026, Worland is a seller-favored market, with 3.8 months of supply. That is down from 4.9 months a year ago. Homes sold at a median of $225K over the trailing year, down 4.9% from the year before.
See the live Worland market→The past 12 months
How the Worland market got here
Is the market leaning toward buyers or sellers?
Is the supply of homes rising or falling?
Are values rising, falling, or holding?
The monthly record
Every month we've recorded
The latest published snapshot for Worland, June 2026. Each completed month is recorded below as a permanent, citable record.
Worland is a smaller market, so we publish its verified monthly data here as a record rather than a full write-up. For the current local picture, see the Worland community page.
June 2026
Seller-Favored Market · 3.8 months of supply
13 for sale · 3 new · 0 under contract · 8 sold · $225K median sold · 30 median days · −4.9% median YoY
May 2026
Balanced Market · 5.5 months of supply
17 for sale · 6 new · 1 under contract · 5 sold · $250K median sold · 48 median days · +13.6% median YoY
April 2026
Balanced Market · 5.8 months of supply
17 for sale · 5 new · 6 under contract · 3 sold · $203K median sold · 53 median days · −6.9% median YoY
March 2026
Balanced Market · 5.3 months of supply
15 for sale · 5 new · 5 under contract · 3 sold · $216K median sold · 53 median days · −1.7% median YoY
February 2026
Seller-Favored Market · 4.4 months of supply
12 for sale · 2 new · 5 under contract · 1 sold · $235K median sold · 53 median days · +10.1% median YoY
January 2026
Seller-Favored Market · 4.1 months of supply
11 for sale · 4 new · 2 under contract · 2 sold · $253K median sold · 53 median days · +17.4% median YoY
December 2025
Seller-Favored Market · 3.3 months of supply
9 for sale · 2 new · 2 under contract · 4 sold · $235K median sold · 56 median days · −1.3% median YoY
November 2025
Seller-Favored Market · 4.5 months of supply
12 for sale · 1 new · 4 under contract · 2 sold · $253K median sold · 52 median days · +13.6% median YoY
October 2025
Balanced Market · 5.2 months of supply
13 for sale · 1 new · 2 under contract · 0 sold · $273K median sold · 51 median days · +18.6% median YoY
September 2025
Seller-Favored Market · 4.1 months of supply
12 for sale · 4 new · 1 under contract · 8 sold · $255K median sold · 44 median days · +11.0% median YoY
August 2025
Balanced Market · 6.2 months of supply
16 for sale · 5 new · 8 under contract · 2 sold · $235K median sold · 64 median days · +5.7% median YoY
July 2025
Seller-Favored Market · 4.9 months of supply
13 for sale · 4 new · 4 under contract · 3 sold · $237K median sold · 51 median days · +1.7% median YoY
June 2025
Seller-Favored Market · 4.0 months of supply
12 for sale · 4 new · 4 under contract · 4 sold · $237K median sold · 53 median days · +2.9% median YoY
May 2025
Seller-Favored Market · 3.7 months of supply
12 for sale · 6 new · 5 under contract · 2 sold · $220K median sold · 74 median days · +2.3% median YoY
April 2025
Strong Seller's Market · 2.2 months of supply
7 for sale · 1 new · 3 under contract · 3 sold · $215K median sold · 53 median days · −6.4% median YoY
March 2025
Strong Seller's Market · 2.9 months of supply
9 for sale · 1 new · 4 under contract · 2 sold · $220K median sold · 41 median days · −4.2% median YoY
February 2025
Seller-Favored Market · 3.0 months of supply
10 for sale · 3 new · 4 under contract · 0 sold · $214K median sold · 75 median days · −9.1% median YoY
January 2025
Strong Seller's Market · 2.0 months of supply
7 for sale · 0 new · 2 under contract · 3 sold · $215K median sold · 74 median days · −7.5% median YoY